
Interim Note
Short GBP/JPY
Contents
Disclosure and the Position
I am short GBP/JPY from 214.21, established on the evening of 2 September 2026. The cash position is supported by long 210 puts expiring 18 September at 3pm London, bought at 42 cents, and by longer dated 205, 202 and 200 puts expiring 16 December, accumulated as the cross traded down through roughly 214, 212 and 210. As I write on the afternoon of 3 September the cross is trading 210.17, down 3.01 per cent on the week and 2.83 per cent on the month. This is a live position, it is in profit, and I am writing about my own book. Read it accordingly.
| Entry | Short cash GBP/JPY from 214.21, 2 September 2026. |
| September leg | GBPJPY 21000P 18 Sep 26 exp, cost 42c, sold at 190c. Rolled into GBPJPY 205P 18 Sep 26 exp, cost 62c. |
| December leg | GBPJPY 205P 16 Dec 26 exp, cost 195c GBPJPY 202P 16 Dec 26 exp, cost 103c GBPJPY 200P 16 Dec 26 exp, cost 125c Bought as market traded down between 213 to 211. Expiry is one day before the December Bank of Japan meeting begins. |
| Base target | 195, the middle of the 184 to 200 anchor and within a yen of the 50 week average at 194.154. |
| Then | 189 on thesis plus acceleration. 177 the decision point, reached only on a decisive break of 183.106. 160 to 172 is rupture. |
| Stop discipline | Two to three big figures on the outright, to make a realistic twenty. |
| Wrong if | Both banks hike twenty five, Ueda emphasises gradualism and October is parked. Gilt yields rise and sterling rises with them. A benign global environment with falling volatility and abundant funding. A sustained recovery to 216 to 220 that builds three weeks of value there. |
Why an Interim Note
I touched on this cross in the technical chart appendix to the August letter. I was vacillating, but fortunately galvanised myself. I already carried meaningful exposure expressing the August thesis, which was that a correction in equities into the mid-terms was available on valuation, sentiment and positioning alone, and that it might compound into something larger. And I was trading gold and silver outright and with options as a spread against this. Adding a second – third position that expressed a related idea felt like doubling rather than diversifying.
Having galvanised myself, I have since changed my mind about that, and the reason is the subject of this note. The two positions are not the same bet twice. One is a view about the price of equities. The other is a view about the price of the money that has been financing them. There is correlated risk, but they are not duplicates and I believe can work independently of each other and even provide inverse correlation.
I am writing between letters because the position has a defined events in front of us in the next few weeks in the form of central bank policy meetings.
A Little Mention of Okinawa
My father-in-law was a fighter pilot in the USAForce stationed in Okinawa at the end of his career, and never left. Lt Col Benjamin Dailey passed this year, the most charismatic, funny-as-fck, loveable, irascible, generous and loving man you could want for. Aged 93 and sharp as a tack to the end. Love you and miss you Big Ben.
I have been watching GBP/JPY for a decade for reasons that have nothing to do with trading.
My wife’s family is in Okinawa. We go twice a year. We have plans there that will eventually require converting a meaningful amount of sterling into yen, and so the question of what this cross is worth is not an abstraction in my household! It is a recurring domestic conversation about whether to move money now or wait.
Okinawa is also, coincidentally, where the bulk of American forces in Japan are based and is why Japan will play ball with the US. The weak yen has been, among other things, a strategic irritant, and this year Washington has stopped pretending otherwise and overtly so.
The practical point is that 216 had been sitting on my weekly charts as an interesting level for months, and I noticed it because I have been looking at this chart for personal reasons rather than professional ones. I did not act at 216 initially as I realised I was in the hope trade it will weaken more over next few years to suit our personal timings. Writing the HindeSight Investor letter as it tended to when I was running external money helped cogently clarify matters. So I acted late last night and put on risk at spot GBPJPY 214.21. Down two big figures off my fabled 216 level. And it is far from a disaster on a cross that has spent years grinding in one direction and while I always tell myself I look for confirmations of tops and bottoms, there is still the ‘competitive inner child’ who wants to nail the top because I think it gives me better risk reward or profits (by way that is rarely the case, the confirmed breakdown is the best risk reward set up).
Two Regime Changes, One Cross
The conventional description of this trade is simple. Japan is normalising and Britain is high yielding. On that description the trade is unattractive, because the carry runs against you.
Underneath the simple description there are two much larger shifts developing, and they happen to point the same way.
Japan is moving out of a world in which yen weakness was sustained by extraordinarily cheap money and occasional currency intervention, and into one in which monetary policy itself begins to resist depreciation. That is a change in the character of the yen, not merely its level.
Britain may simultaneously be moving out of a world in which high yields attract capital and into one in which high yields represent compensation for inflation risk, fiscal fragility and restrictive domestic financial conditions. That is a change in what a gilt yield means.
Both of those are regime changes rather than cyclical moves, and GBP/JPY is the cross where they intersect. That is the whole thesis. Everything below is supporting evidence.
The Arithmetic Play, Which Is Less Dramatic Than It Sounds
The attraction of this cross is that it is two trades in one instrument. GBP/JPY is simply GBP/USD multiplied by USD/JPY, which means it does not require an extraordinary move in either constituent to produce a large move in the cross.
| GBP/USD | USD/JPY | GBP/JPY |
|---|---|---|
| 1.3123 | 160.15 | 210.2 (here) |
| 1.30 | 150 | 195.0 |
| 1.28 | 148 | 189.4 |
| 1.25 | 142 | 177.5 |
From where I am short, 195 requires sterling to fall a little over three per cent against the dollar and the yen to appreciate a little over six per cent. Neither of those is a crisis. Both are entirely ordinary currency adjustments. What makes 195 interesting is that they would need to happen at the same time, and the argument of this note is that the same set of conditions produces both. The set up is a thing of beauty. 2 to 3 big figure GBPJPY stop on the outright to make a realistic 20.
The lower numbers require progressively more of a third element, which is deleveraging, and I will come to that.
Japan, Where the Surprise Is Not Fifty Basis Points
The policy rate is one per cent following the June hike, the highest in thirty one years. The Board meets on 17 and 18 September.
I want to be precise about what is priced, because the retail rate probability sites are misleading here and I was briefly misled by one of them. The meeting-dated TONA overnight index swap strip from Totan ICAP puts the September contract at 1.2225 mid. The unsecured overnight call rate, which is what the swap actually references, fixed at 0.977 on 2 September against a one per cent target, with a high of 1.030 and a low of 0.950. The gap between fix and target is the familiar structural feature of the Japanese money market, where investment trusts and agricultural institutions lend below the complementary deposit floor because they earn no interest on those balances.
Anchored correctly on the 0.977 fix, September is 98.2 per cent of a twenty five basis point move. Anchored lazily on the one per cent target it looks like 89 per cent. Either way, September is finished. There is no hike premium left to collect and there is effectively nothing priced for fifty basis points.
The front end has already moved a very long way. The two year JGB reached 1.830 per cent on 2 September, the highest since 1995. The ten year has traded above three per cent for the first time since 1996.
Here is the part I had wrong when I first drafted this. My initial reasoning was that the market still assumed the Bank would hike roughly twice a year, and that Hajime Takata’s Sapporo speech on 2 September, in which he described 2026 as a regime change requiring nimble meeting by meeting decisions rather than a fixed semiannual rhythm, would force a repricing toward quarterly. Deputy Governor Himino had used almost identical language a week earlier.
The strip says that repricing has substantially already happened.
Four and two thirds hikes by January 2028, a terminal above 2.15 per cent, and a curve that has still not flattened at the far end. That is already a quarterly cadence. The market has read Takata and believed him.
What is left is one number. October is priced at seven basis points, twenty eight per cent of a hike. Given the same Reuters sourcing that reported the Bank considering a faster pace than twice a year, and given Takata’s explicit refusal to rule out back to back moves, that looks light to me. If Ueda declines to exclude October in the press conference, that contract has to travel from 1.2925 toward 1.40, which is twenty five basis points of front end repricing in an afternoon. That is the yen move. The hike itself is not.
What the TONA Strip Prices
| BoJ meeting | OIS mid | Step (bp) | Cumulative from 0.977 (bp) | Hikes |
|---|---|---|---|---|
| Sep-26 | 1.2225 | 24.6 | 24.6 | 0.98 |
| Oct-26 | 1.2925 | 7.0 | 31.6 | 1.26 |
| Dec-26 | 1.4388 | 14.6 | 46.2 | 1.85 |
| Jan-27 | 1.5363 | 9.7 | 55.9 | 2.24 |
| Mar-27 | 1.6663 | 13.0 | 68.9 | 2.76 |
| Apr-27 | 1.7563 | 9.0 | 77.9 | 3.12 |
| Jun-27 | 1.8475 | 9.1 | 87.1 | 3.48 |
| Jul-27 | 1.9288 | 8.1 | 95.2 | 3.81 |
| Sep-27 | 1.9688 | 4.0 | 99.2 | 3.97 |
| Oct-27 | 2.0150 | 4.6 | 103.8 | 4.15 |
| Dec-27 | 2.0775 | 6.2 | 110.0 | 4.40 |
| Jan-28 | 2.1400 | 6.2 | 116.3 | 4.65 |
I should be honest about the case against tightening at all, because it is a good one. Core inflation excluding fresh food was 1.8 per cent in July and has been below the two per cent target for six consecutive months. Second quarter GDP grew 1.1 per cent annualised with private consumption contributing precisely nothing and capital expenditure falling 1.2 per cent. The entire growth number came from net exports and government spending.
What separates this from the classic Japanese policy error is the wage data. Three consecutive spring wage rounds above five per cent, the most recent settling at 5.01 per cent with small and medium sized firms at 4.69 per cent, and six consecutive months of positive real wage growth. That is not an oil shock ‘artefact’ for what of better word. It is the first genuinely self-sustaining wage and price mechanism Japan has produced in thirty years, and it is why the Bank can characterise what it is doing as removing an extraordinary policy regime rather than imposing restriction. With the policy rate at one per cent against underlying inflation near two, the real policy rate remains negative.
The second element on the Japanese side is that the policy architecture which sustained one-way yen weakness has changed. The Ministry of Finance spent 15.4 trillion yen between 30 July and 26 August, the largest monthly intervention on record, including a single day operation of roughly 8.45 trillion yen executed jointly with the US Treasury. That was the first coordinated yen buying by the two countries since 1998. It did not hold. The cross is back near 160 because of Warsh’s comments inferring a US rate hike risk in September. But the asymmetry it establishes is real. Excessive yen weakness now raises the probability of intervention and simultaneously raises the probability of tightening, because a weaker yen raises imported inflation in a resource importer facing an oil shock. So both mechanisms lean the same way.
Britain, Where Good Yield May Be Turning Bad
The UK side of this trade may end up mattering more than the Japanese side.
Conventionally, high British rates support sterling. Higher yields improve the carry advantage, capital is attracted, the currency rises. That relationship has held for most of the period any of us have been trading. I am not convinced this will last where rates/yields and GBPUSD is priced.
Sovereign yields carry information as well as return and I think that information will be interpreted another way. There is a threshold beyond which investors stop reading a higher yield as an attractive return and start reading it as compensation for risk. Past that threshold the relationship inverts. Rising inflation risk, rising fiscal risk and a rising term premium push gilt yields up and sterling down at the same time. As arguably has occurred in Japan this past 12 months.
The feedback loop is unpleasant once it starts. Higher gilt yields raise debt service costs, which reduces fiscal headroom, which forces tax rises or spending restraint, which lowers growth expectations, which worsens the fiscal arithmetic and raises the term premium again. Sterling falls through that sequence, which raises imported inflation, which constrains the Bank from easing, which keeps mortgage and corporate borrowing costs elevated, which weakens consumption and investment, and damages growth further. That is precisely how higher rates stop being supportive for a currency.
The BoE Bank Rate has stood at 3.75 per cent since December 2025. What is striking is the direction of the internal debate. The hawkish minority has grown at three consecutive meetings, from one dissenter in April to two in June to three in July, when Greene, Mann and Pill all voted for four per cent. The Committee’s own July minutes recorded members discussing the extent to which tightening financial conditions reflected a market perception that risks to Bank Rate were skewed to the upside. Ten year gilt yields have since reached their highest level since 2007, and the rise in borrowing costs has eroded fiscal headroom ahead of the October Budget.
Now to the evidence I did not have when I put the position on.
Britain Repriced Hawkishly On Its Own
This is the one day change in meeting-dated OIS across three curves, taken at 13:22 London on 3 September.
| Meeting | SONIA (bp) | Fed funds (bp) | ECB (bp) |
|---|---|---|---|
| Sep-26 | +0.4 | +2.6 | +0.1 |
| Oct / Nov-26 | +1.5 | +2.2 | −0.7 |
| Dec-26 | +3.3 | +1.9 | −1.9 |
| Jan / Feb-27 | +4.8 | +2.1 | −2.4 |
| Mar-27 | +5.4 | +1.8 | −2.5 |
| Apr / May-27 | +6.2 | +1.5 | −3.0 |
| Jun-27 | +7.1 | +0.2 | −3.6 |
| Jul-27 | +7.7 | −0.9 | −4.1 |
Read the far right of each row. On the same afternoon, the market raised UK rate expectations most at the back of the curve, left the American curve broadly unchanged at the front and marked it down at the back, and cut European expectations at every tenor with the largest reduction at the longest point.
The UK is repricing hawkishly in isolation. If British rate expectations were rising because British growth were strong, you would expect some correlation with the global picture. Instead the UK terminal rate is going up while the American and European terminal rates are coming down.
That is not proof. It is one afternoon. But it is precisely the pattern the bad yield thesis predicts, and it is exactly the test I would have designed. UBS currently makes the opposite case, that sterling remains attractive on high yields, improved fiscal credibility and scope for short positioning to be reduced. That view is useful because it makes the disagreement testable. If gilt yields rise materially again and GBP/USD rises with them, conventional carry is still dominant and I am early. If gilt yields rise and GBP/USD falls, then what the market is saying is that it requires a higher yield because it is less willing to own British duration. At that point yield has become risk premium.
I do not need to be right about this in advance. I need to watch the test. As we go to print, Huw Pill was speaking at the Edinburgh Chamber of Commerce and a headline flashed up. “Bank of England Chief Economist Pill: Raising Bank Rate on This Basis Doesn’t Signal Prolonged Aggressive Hikes.”
I want to be careful about what that does and does not say, because the obvious reading is the wrong one. Pill is a hawk. He voted for four per cent in April, June and July, and the substance of these remarks is an argument in favour of raising Bank Rate promptly, on the grounds that acting now heads off what he called the insidious catch-up nominal dynamics that turn a temporary inflation overshoot into a persistent one. Nothing in that is dovish about the September meeting.
The interesting part is the second half of the sentence. A rise “need not be the start of a prolonged and aggressive series of increases.” That is the Bank’s most hawkish member volunteering, unprompted, that the terminal rate is lower than a hiking cycle would normally imply. And the terminal rate is the whole of my argument. The sterling curve currently carries almost three hikes to July 2027. If the Committee’s leading hawk is already framing a hike as a one-off insurance payment rather than the opening of a cycle, the back of that curve is carrying more than the Bank itself intends to deliver.
Which is music to my ears, because the compression I need in sterling yen does not come from the next meeting. It comes from the path. More on this below.
Four Curves Anchored From Sept 26
Setting the anchors aside and measuring each curve from its own September meeting produces the cleanest comparison available.
| Central bank | Tightening priced Sep-26 to Jul-27 | Hikes |
|---|---|---|
| Bank of Japan | +70.6bp | 2.83 |
| Bank of England | +67.0bp | 2.68 |
| ECB | +50.0bp | 2.00 |
| Federal Reserve | +46.1bp | 1.84 |
Japan and Britain are the two fastest tightening curves in the developed world over the next ten months. Every major central bank is now priced to raise rates, which is itself worth pausing over given where we were eighteen months ago.
For the September meetings themselves, on reasonable assumptions about where each overnight benchmark fixes relative to its policy anchor, the picture is very uneven.
Three central banks inside seventy two hours, in an order that hands me the sterling leg circa twenty four hours before the yen leg. The Federal Reserve concludes on the 16th, the Bank of England announces at noon on the 17th, and the Bank of Japan announces on the 18th, with no committed release time.
These two charts answer different questions and the difference is the trade. The second one is a single meeting. The first is a cycle. Read them together and the picture is this.
Japan has both the meeting and the cycle baked in. Ninety eight per cent for September, and 2.83 hikes priced through to July 2027. There is nothing left to collect from the hike and very little from the path. What remains is the October guidance, which is the twenty eight per cent I keep coming back to.
Britain has the cycle baked in but not the meeting. Only twenty two per cent for the seventeenth, yet 2.68 hikes priced through July 2027, second only to Japan and well ahead of the Federal Reserve. The market is not expecting Bailey to move in a fortnight. It is expecting him to deliver most of a hiking cycle over the following year.
The Federal Reserve has neither. Sixty six per cent for a meeting that Waller is publicly arguing against, and the shallowest path of the four at 1.84 hikes.
So the only one of the three where the near-term event is genuinely undecided is the Fed, and the only one where the cycle is heavily priced on thin foundations is Britain. Those are two separate sources of asymmetry pointing the same way for this position, and they arrive four days apart. The Fed asymmetry pays out on 16 September. The British one takes months and is the subject of the next section.
The Federal Reserve, and What Washington Actually Wants
This is the variable I am least sure about, and I would rather say so than pretend the position rests on a clean view.
The market has moved to roughly two thirds priced for a September hike, essentially all of it since Kevin Warsh’s Jackson Hole address on 28 August, where he said underlying inflation trends had not meaningfully improved and that the Fed had work to do. Before that speech the market saw very little chance of a move before December.
I do not think he hikes.
The labour data likely alone does not support it. July payrolls came in at minus 23,000 against expectations of plus 80,000. May was revised down by 66,000 and June by 37,000, following the previous month’s downward revisions of 74,000 to April and May. Then on 28 August the preliminary benchmark revision cut the level of employment for the twelve months through March 2026 by 79,000, with private employment cut by 178,000. Economists had expected an upward revision of 183,000. Average monthly job growth over the year to July has been running near 32,000. That is a labour market decelerating in level, in flow and in revision at the same time.
Against that, the inflation Warsh is worried about is an energy supply shock coming out of the Strait of Hormuz. Raising rates does not produce oil Warsh has also been consistent about the productivity argument on artificial intelligence, and he said at Jackson Hole that the economy appeared to have strengthened, though citing the benefits of AI and resilient spending. That framing gives him an intellectually a coherent route to holding, which is that the initial inflationary impulse from AI capital expenditure is a relative price effect sitting on top of a rising productivity trend, and that a supply shock is not the thing a central bank should be tightening into with employment already contracting.
So my view is that Warsh talks hawkish and does not move, and that two thirds priced is too high.
As I edit this, Waller is on the tape and he is making my argument for me. He said this morning that if there is continued progress toward the 2% goal he is willing to support holding the policy rate at its current level, that his decision will be heavily influenced by what the August inflation print shows, and, most usefully for the argument above, that he does not see elevated energy prices and tariffs as a significant source of ongoing inflation pressure. He noted that three month core PCE has fallen from 4.76 per cent in February to 3.05 per cent now. That is a sitting Governor saying, in as many words, that the supply shock is not bleeding into underlying inflation and therefore is not the thing to tighten into. Nick Timiraos, the Wall Street Journal’s key Fed reporter, captured it well. Waller’s basic posture has not changed since July, but the tilt has moved from “worried and leaning toward tightening” to “tentatively encouraged and leaning toward holding.” The August CPI and PCE prints will decide it. Gold and equities rallied off the back of it, along with a three to six basis point rally off recent lows in September and December SOFR.
He left the door open, and I should quote that too rather than only the half I like. If inflation comes in hot he would consider a hike, and he described the current 3.50 to 3.75 per cent policy rate as only slightly restricting aggregate demand, adding that it might not take much acceleration in inflation to nudge him toward tighter policy. So the August CPI released a few days before the meeting becomes a serious point of focus.
But the contrast with the Chairman is now explicit and on the record, and it is a contrast the market has not fully absorbed. Warsh at Jackson Hole said underlying inflation had not meaningfully improved. Waller says the recent trend suggests we are finally seeing some signs of disinflation. Two thirds priced assumes that argument has already been settled in the Chairman’s favour. It has not been.
The Carry Does Not Compress But That Is Where the Opportunity Lies
Now the more interesting speculation. Scott Bessent has been unusually direct in pressing the Bank of Japan. He has said publicly that he expects the Bank to do the right thing, he was reported to have urged both Ueda and the government to raise rates, and on 31 August he described recent yen moves as pretty well contained, which arguably lowers the bar for further coordinated action rather than raising it. Bloomberg has reported that Tokyo’s own government supports an early hike specifically to sustain the effect of the coordinated intervention.
Put those together and a picture emerges which I think is under-discussed. Washington appears to want the US-Japan interest-rate differential narrowed, but the direction of that adjustment matters. A Fed hike would do the opposite of supporting the yen: it would widen the differential further, increase the relative attraction of dollar assets and reinforce the economics of yen-funded carry. Fed easing would help, but Washington cannot rely on the Federal Reserve to close the gap sufficiently or quickly enough. Renewed intervention, meanwhile, burns reserves and risks being temporary unless the underlying monetary incentive changes.
That leaves the Bank of Japan as the clearest policy lever. Bessent has spoken with Warsh. If the Treasury’s preference is for the differential to narrow from the Japanese end, then the pressure on Ueda to be more hawkish than the market expects on 18 September is considerably greater than the price action had been suggesting; though this has changed noticeably in the last 24 hours.
I am genuinely torn on the precise mechanism, and I would not put too much weight on the specifics. But the direction is consistent across everything observable, and it points to a hawkish Bank of Japan rather than any need for a hawkish Fed.
That produces four outcomes worth setting out plainly.
| Fed holds (my view, 34% priced) | Fed hikes (66% priced) | |
|---|---|---|
| BoJ 25bp and opens October | Best case. US-Japan differential narrows, the Japanese path reprices, USD/JPY breaks lower and the cross follows. | Mixed. The immediate differential is broadly unchanged, but the Japanese path reprices more hawkishly. Some yen gain, but less dramatic. |
| BoJ 25bp, gradualist tone | Yen improves because the differential narrows on the Japanese leg, but without a meaningful change in the expected BoJ path the move may lack conviction. | Worst case. The immediate differential is effectively unchanged, there is little new information on Japan’s terminal rate, USD/JPY risks moving back through 162, the cross squeezes and the September puts die. |
Note what the bottom-right corner implies. Both central banks hike twenty five, the Bank of Japan says nothing materially new, and the policy differential is essentially unchanged. In relative-rate terms, very little has improved for the yen. The carry incentive remains largely intact and the market can quickly rebuild the same trade.
That outcome serves neither Washington nor Tokyo particularly well, and it is precisely why I think one side of the equation may have to deliver something the market is not fully expecting. Given the political and institutional constraints on the US side, the more obvious place for that surprise is the Bank of Japan.
Here is perhaps the least comfortable number in this note.
Under current OIS pricing, the sterling carry advantage over the yen barely compresses at all. SONIA less TONA starts around 255 basis points, actually widens to roughly 262 basis points by March 2027, and is still 252 basis points by July. On the curve as it stands today, therefore, there is almost no monetary-policy assistance for a GBP/JPY short.
By contrast, the dollar behaves quite differently. Fed funds less TONA falls from roughly 256 basis points to 232 basis points over the same period. On the market’s existing policy assumptions, USD/JPY is therefore the cleaner yen expression and GBP/JPY the worse one. That needs to be acknowledged plainly.
But I think that is also where the opportunity lies.
| Meeting | SONIA less TONA (bp) | Fed funds less TONA (bp) |
|---|---|---|
| Sep-26 | 255 | 256 |
| Dec-26 | 260 | 257 |
| Mar-27 | 262 | 249 |
| Apr-27 | 260 | 244 |
| Jun-27 | 256 | 238 |
| Jul-27 | 252 | 232 |
The chart and table are not telling us what the differential will be. It is telling us what is already priced! And the remarkable feature is how little less hiking or even easing, the sterling curve allows despite an economy that the Bank of England expects to remain subdued through 2026 and into early 2027. The Bank projects weak underlying growth, a widening margin of spare capacity and restrictive monetary policy continuing to weigh on demand.1 Bailey has also recently emphasised the softness of the labour market and the limited evidence so far of second-round inflation effects from the energy shock.2
That creates a potentially powerful asymmetry. If the BoJ turns more hawkish at the same time that UK growth disappoints and the Bank of England is eventually forced towards a materially easier policy path, the sterling-yen differential can compress from both ends. Japanese rates would be repriced higher while expected UK rates would be repriced lower. The resulting compression in SONIA versus TONA would progressively remove one of the principal supports beneath GBP/JPY.
And there is plenty of room for that repricing precisely because it is not in the curve today.
Indeed, there is another important wrinkle here. The Bank of England itself has warned against taking the current OIS curve literally. Its own work suggests that much of the upward slope in the UK short-rate curve following the Middle East shock reflects unusually elevated risk premia, rather than the market’s central expectation that Bank Rate will actually rise. After stripping out that risk premium, the Bank’s model-implied expected path for Bank Rate was broadly flat over the following year and declined thereafter.3 The June MPC minutes reached much the same conclusion, noting that the upward slope of the OIS curve was being driven largely by risk premia rather than market participants’ most likely path for Bank Rate.4
That distinction matters enormously. I am not doing the GBP/JPY short because today’s forward curve says the carry disappears. I am interested in it partly because it says the opposite. The market is still asking sterling to retain almost its entire yield advantage over Japan through next summer. If that assumption proves wrong, there is substantially more differential compression available in GBP/JPY than this chart currently shows.
And given the UK’s fiscal constraints, restrictive financial conditions and distinctly unimpressive growth outlook — Burnham may be more likely to make Burning Man next year than the UK is to sustain the growth required to justify that curve — I am not convinced the present SONIA path survives intact. The Bank’s own central projection has UK growth remaining subdued through 2026 and early 2027, while its adverse scenario sees four-quarter GDP growth trough at just 0.6%.1
So USD/JPY is the cleaner trade on today’s curve. GBP/JPY may be the more interesting trade if today’s curve is wrong.
That, I think, is the real point of the chart.
The Embedded Leverage Layer Underneath
The size of the leveraged exposure sitting on the yen is not knowable with precision, and even the BIS says so directly, who have more insights than most. Tracking carry positions is described as notoriously difficult, because a large share of modern carry is built synthetically through forwards, swaps and options rather than through visible yen bank borrowing. Those instruments create an obligation to deliver yen without a yen loan appearing on anyone’s balance sheet.
What we do have is August 2024. The BIS estimated roughly 40 trillion yen, around 250 billion dollars, of yen carry exposure going into that unwind, and stated explicitly that the figure was probably biased downward by data gaps. It found hedge funds running leverage of approximately four to one on conventional measures and around fourteen to one once synthetic derivative exposure was included. It also found that the funds most exposed to currency carry were simultaneously exposed to the markets that became the epicentre of the selloff, and that the partial unwind transmitted tighter financial conditions from Japan into the United States.
Fourteen to one does not require a large adverse move before risk managers start demanding reductions.
The most directly relevant work is a BIS bulletin published on 6 May this year, on monetary policy transmission to exchange rates and the role of currency carry trades. Its conclusion is that significant short positions by carry traders in funding currencies amplify the impact of policy tightening, because leveraged positions accumulated before a policy announcement are unwound afterwards.
That changes how the Bank of Japan catalyst should be read. The hike does not itself have to justify a large yen appreciation. It only has to move the funding currency enough to alter the economics of leveraged positions. After that the sequence becomes self-reinforcing. Yen appreciation produces carry losses, which raise value at risk, which forces leverage reduction, which requires yen to be repurchased, which appreciates the yen further, which pressures risk assets, which raises volatility, which forces further deleveraging. The currency becomes both cause and consequence.
None of this is unique to the yen. The same mechanism applies to the Swiss franc, which is why GBP/CHF is a useful control. If sterling begins falling against both the yen and the franc while gilt yields remain elevated, that tells us sterling itself is the problem rather than the cross merely reflecting Japanese policy.
There is a further layer I cannot quantify and will not pretend to. Private banks continue to place high net worth clients into structured products whose economics resemble carry. SMBC Trust currently markets a premium structured deposit with an embedded currency option allowing clients to move between yen and foreign currencies including sterling and the franc, with an explicit principal loss warning. The BIS was documenting bank-manufactured carry indices and structured instruments referencing them in 2007, immediately before the last great unwind. Historical work on Japanese power reverse dual currency notes found that dealer hedging of those instruments was highly nonlinear and required dynamic adjustment as the yen moved.
I am not going to claim that today’s structured note book is positioned in a way that mechanically amplifies yen appreciation, though anecdotally I am aware of a number of private banks in Asia, Singapore notably offering such products. Though I do not have the data to say that. The defensible statement is narrower and still useful. The observable institutional carry trade is only one layer of the exposure. Structured products and derivative-based client positions create additional contingent exposures whose size and hedging behaviour are largely invisible in public positioning data. That is the kind of hidden leverage that becomes relevant once volatility rises and frankly FX volatility is mispriced.
Where This Meets the August Thesis
Readers of the August letter, and of what I wrote about what a short position in Advantest taught me regarding AI valuations, will see the connection.
The AI complex has been financed, in part, by cheap funding and low volatility. Not exclusively, and I am not making a monocausal claim. But the BIS found that multi-strategy funds increased their exposure to currency carry while simultaneously increasing exposure to Japanese equities, and that the funds most exposed to carry were exposed to the assets that broke first in August 2024.
That gives the two positions a shared root. The August thesis says equity valuations have run past what sentiment and positioning can support. This position says the funding condition underneath those valuations is changing. If I am right about the second, the first becomes more likely rather than less, which is why I concluded that adding this was not doubling the same trades I already have on.
In 2008 the causality ran from a credit crisis to deleveraging to carry unwind to yen appreciation. The interesting possibility in 2026 is Japanese tightening more and this propagating outward into risk assets. The BIS work published in May provides empirical support for exactly that state-dependent transmission.
I am not forecasting another 2008. The banking system is different, the origin of the leverage is different and the policy framework is different. But the transmission mechanism is recognisable, and the useful lesson from 2008 is not that GBP/JPY fell fifty per cent and could do so again. It is that there are two market regimes. In a valuation regime, investors ask what the expected return is and optimise for carry and fundamentals. In a liquidation regime, they ask how much risk they must remove. Once the second regime arrives, the price at which a position originally looked attractive stops mattering. Risk budgets, margin calls, redemptions and prime broker balance sheets become the marginal price setters. That is why carry unwinds overshoot fundamental models so badly.
A carry trade behaves like a valuation trade until leverage begins contracting. After that, the funding currency becomes the asset participants are forced to buy.
How I Read the Chart
I am definitely a chartist, and Market Profile in the form Peter Steidlmayer developed at the Chicago Board of Trade has been my staple for years. It stops treating price as a line and treats it as a distribution. It asks not where price went but how much time it spent there, which is the closest observable proxy for where trades actually got done. A market that spends weeks building a fat distribution has found genuine two-way business. A market that traverses a range in a session has found nobody willing to take the other side. The two look identical on a line chart and behave completely differently on a retest.
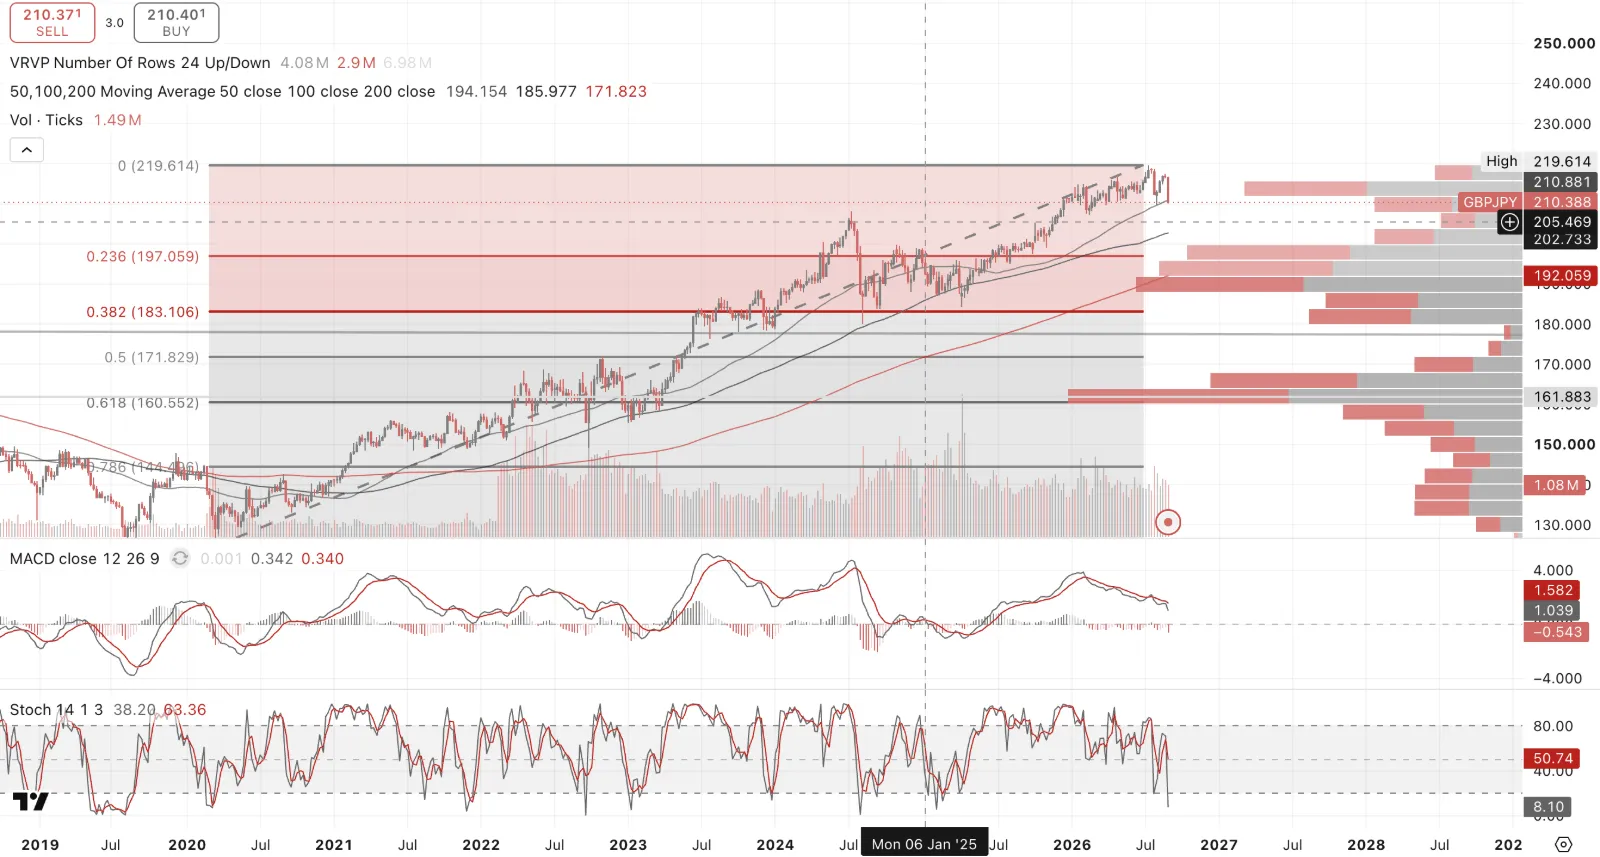
The candles. Three things resolved together at the highs. Distribution rather than acceleration into the horizontal at the top of the range. Repeated rejection of it, each probe printing a small body with an upper shadow. And then a bearish three line strike, four weeks of advance given back in one. A market that takes four weeks to travel a distance and one week to return it was not being accumulated on the way up. Bulkowski’s work found the pattern resolves as a continuation more often than a reversal, so I am not leaning on it alone. I am leaning on where it appeared, immediately below a horizontal already rejected several times, with the rising trendlines broken.
Momentum has turned on both timeframes. Weekly MACD has crossed below its signal at minus 0.543 and the monthly has now done the same at minus 0.196, a monthly bearish crossover after a six year advance. The weekly stochastic is at 8.10, about as oversold as this reads, which makes a sharp countertrend bounce the most likely near-term source of pain. It will not get back to the highs before that date, so what I would expect is a short covering rally rather than anything more, and I believe it will be a short lived dead cat bounce. The December structure exists so that I do not have to be right about the next fortnight.
The volume histogram. One caveat first. Spot GBP/JPY has no consolidated tape and therefore no true volume. What follows is tick volume from a single retail-facing venue, counting price updates rather than size. It is a proxy for participation, not a measurement of it. Weekly and monthly below, same retracement on each.
GBP/JPY Weekly With Visible Range Volume Profile
GBP/JPY Monthly With Visible Range Volume Profile
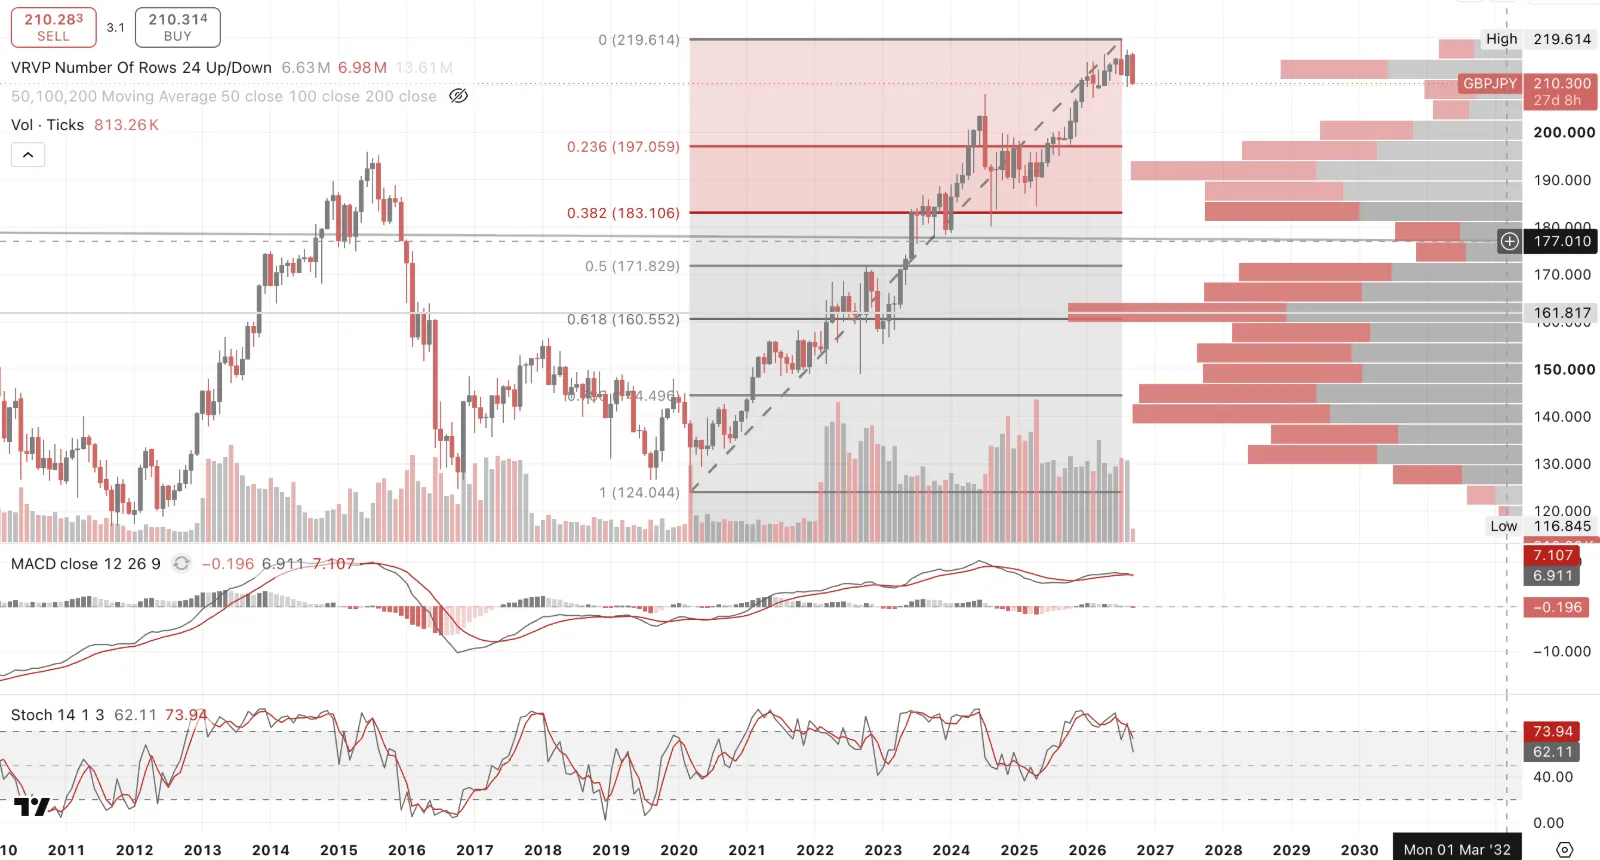
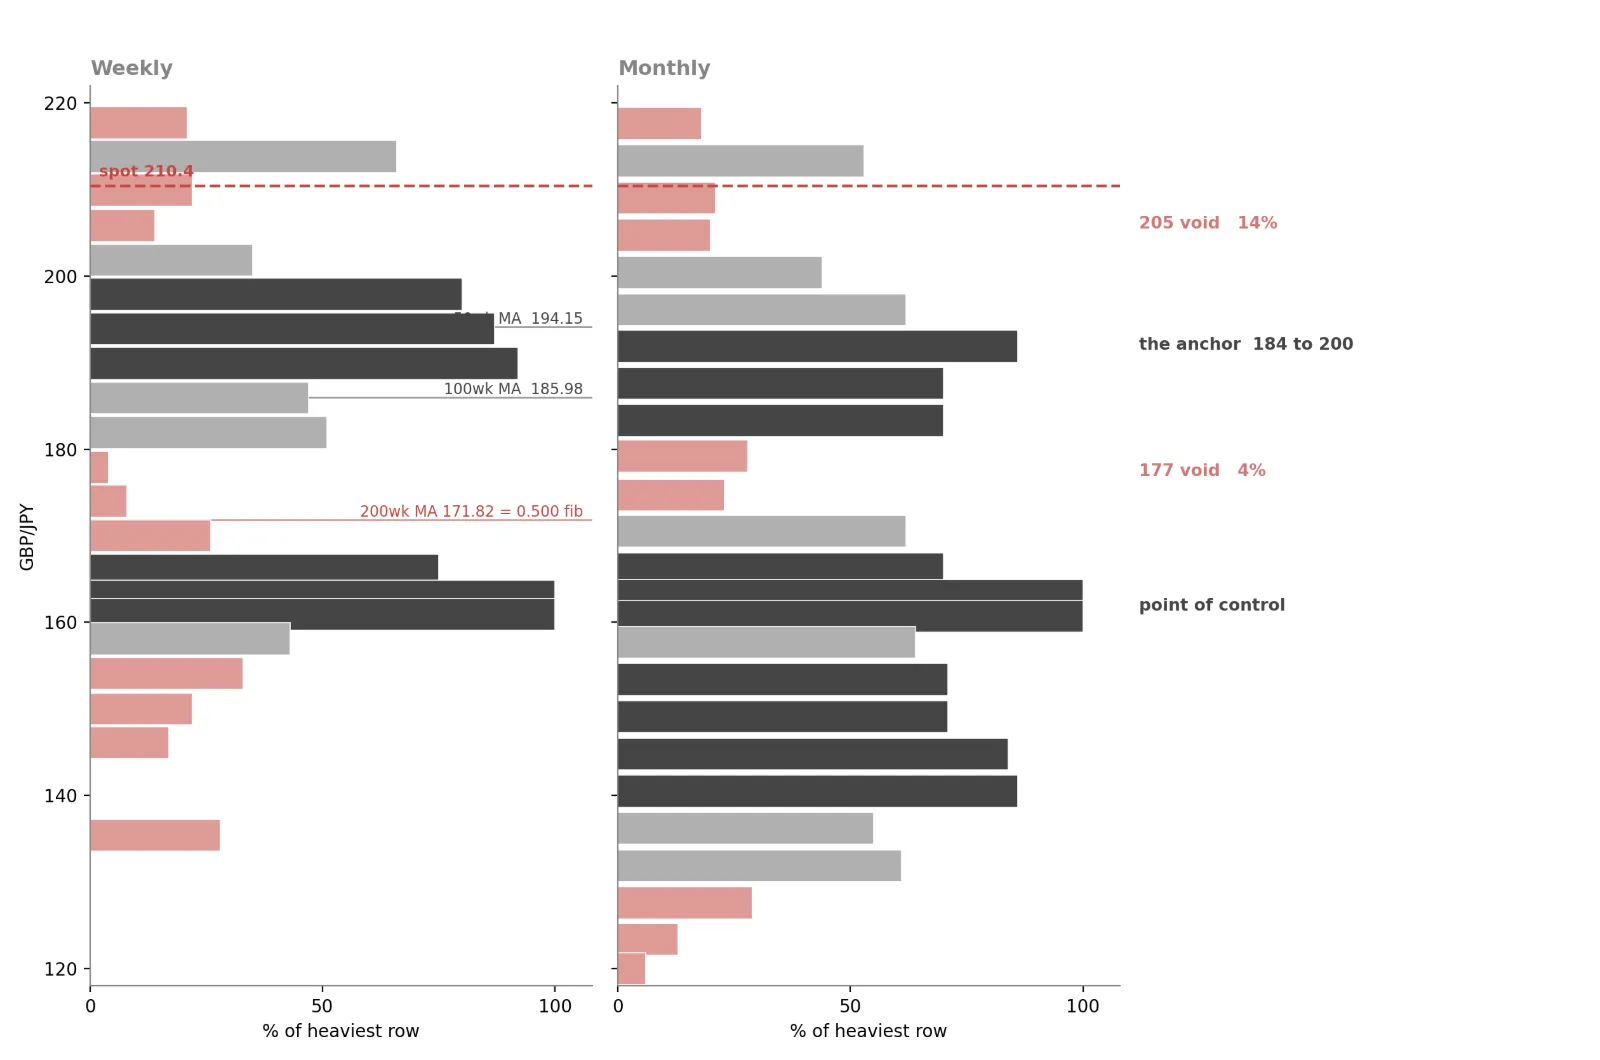
The weekly carries the moving averages. The 50 week at 194.154, the 100 week at 185.977 and the 200 week at 171.823, that last within six thousandths of a yen of the 0.500 retracement at 171.829. The heaviest row on both timeframes sits between 160 and 164, directly on the 0.618 at 160.552. Measuring every row against it gives the structure below.
| Band | Weekly | Monthly | What it means |
|---|---|---|---|
| 216 to 220 | 21% | 18% | The high was unsupported |
| 212 to 216 | 66% | 53% | Shelf, recently vacated |
| 208 to 212 | 22% | 21% | Thin. Spot is here |
| 204 to 208 | 14% | 20% | Thinnest area above the anchor |
| 200 to 204 | 35% | 44% | Still light |
| 184 to 200 | 47 to 92% | 62 to 86% | The anchor |
| 180 to 184 | 51% | 70% | Lower edge of solid ground, 0.382 sits here |
| 172 to 180 | 4 to 8% | 23 to 28% | The deepest void on the chart |
| 168 to 172 | 26% | 62% | Light, 200 week MA and the 0.500 fib |
| 160 to 164 | 100% | 100% | Point of control |
The anchor is broader than the retracements suggest. The 184 to 200 band is the centre of gravity of the whole advance, 80 to 92 per cent across four consecutive rows on the weekly. The 50 week average sits inside it at 194.154, the 100 week marks its lower edge at 185.977, and the 0.236 at 197.059 marks its upper edge. My base target of 195, set from fibo arithmetic before I had any of this in front of me, lands in the middle of it and within a yen of the 50 week. A market falling out of thin air at 210 should not stop before it and should struggle to pass through it without a fight.
On 177 the obvious reading is too quick. It is tempting to look at a thin band, call it ‘air’, and assume price simply falls through. But a low volume node is a record of prices the auction previously rejected, and rejection is what makes it a reference on the return. At 4 per cent it is the single thinnest row on the weekly profile. I have watched this cross reject that area before, which is why the line has been on my chart for years.
What tells you which resolution you get is time, not price. A sharp reaction on arrival is rejection and the void held. Time accumulating inside it, even a session or two, is acceptance, and once that happens the void stops being a floor and becomes a through-route with nothing between there and 172 to 164. There is no slow middle path, which is exactly why these areas are worth watching and the round numbers either side are not.
The same rule applies to the level in front of me. At 14 per cent the 204 to 208 band is the thinnest row above the anchor and the cross is sitting on it. Bounce sharply and the decline was a probe. Settle below 208 and build time there and the anchor at 200 arrives fast. The market has just demonstrated the rule one shelf higher, leaving 212 to 216 in two sessions without building anything.
Acceptance through 177 is not my base case. It requires the entire 184 to 200 anchor to have been worked through first, which is a great deal of work, and that is why the deepest scenario here stays a tail. The trigger I am watching is 183.106, the lower edge of the anchor and the 0.382. Above it this is a correction within the advance. A decisive monthly close below drops into four per cent participation with almost nothing until 168, and behind that the point of control.
Two caveats. Row boundaries are measured off the histograms rather than read from a data table, so treat every level as plus or minus a yen, and with twenty four rows nothing finer than about four yen is resolvable.
The Levels
The retracement I carry on both timeframes runs from the 124.044 low to the 219.614 high.
| Retracement | Level |
|---|---|
| 0.236 | 197.059 |
| 0.382 | 183.106 |
| 0.500 | 171.829 |
| 0.618 | 160.552 |
| 0.786 | 144.496 |
| Retracement | Level |
|---|---|
| 23.6% | 211.30 |
| 38.2% | 206.16 |
| 50.0% | 202.00 |
| 61.8% | 197.84 |
| 78.6% | 192.29 |
| Origin | 184.83 |
Within that, the shorter weekly retracement from the 184.83 low gives the intermediate structure the December strikes were built around. The first has already gone. The sequence from here is 206, then 202 and 200, then 198, then 192, then 185.
The gateway. The most important area on the chart is 197 to 198. The weekly 61.8 per cent sits at 197.84 and the long term monthly 23.6 per cent sits at 197.06. Above it, this is still describable as a correction of the 2025 and 2026 advance. A decisive weekly close below it changes market dynamics, because the market may then be correcting the entire move from 2020. The monthly retracement from 124.04 to 219.61 puts the next level at 183.11, then 171.83.
195 is the thesis, the base target, and it sits in the middle of the anchor at 184 to 200, within a yen of the 50 week average.
189 is the thesis plus acceleration, requiring independent sterling weakness alongside yen strength, and it means trading through the anchor rather than stopping in it.
177 is the decision point, reached only on a decisive break of 183.106, and it resolves quickly in one direction or the other because there is no business there to hold it.
160 to 172 is rupture. Getting to 177 or lower requires a substantial funding currency squeeze brought about by broader risk deleveraging on top of everything else. The first does not need a crisis. The last needs the move to change character entirely, from monetary repricing into leveraged liquidation.
How the Position Was Built
The December strikes were chosen to sit over the technical cascade rather than at arbitrary distances. 205 sits just below the weekly 38.2 per cent at 206.16. 202 sits on the half. 200 is psychological and sits immediately above the 61.8 per cent at 197.84. They move progressively into the money through the central portion of the retracement rather than requiring a single large move.
They expire on 16 December, which is before the December Bank of Japan decision rather than after it. They therefore capture the repricing into the meeting but not the announcement itself, and we will know by then. They also span the October Budget and the Bank of Japan meeting on 29 and 30 October, which as set out above is the one meeting the market has not properly priced.
The other reason for putting the December structure on where I did was the volatility surface. December at-the-money implied was sub eight per cent, and it is about 0.6 per cent higher now. The 210s were sub eight per cent implied four points out of the money, when the Q3 and Q4 period has had historical realised vols of ten to twelve per cent, because there have been more surprises, hikes and the like, in previous years. More to the point, the out-of-the-money curve was flatter than it is now, with less skew, and that is where the convexity was for me. I thought the market was being far too complacent.
When I bought the 18 September puts at forty two cents the cross was 214.21 and the strike was four yen away. I did think the market would move. 18 September was nine to ten per cent vol. On that basis the market was assigning something like an eighteen per cent probability of finishing below 210. So I thought the market was being complacent. I did not write at the time that I thought I was disagreeing with the option market, I just knew it was cheap for that period, with visible rhetoric from policymakers, Bessent and Bank of Japan members, that there might be a bigger move in the yen than the market was pricing optionality-wise.
Two sessions later the cross is 210.17. Those puts are now at the money, worth somewhere near 1.70 against the 42 cents paid, with a delta of minus 0.50 and a probability of expiring in the money of about half rather than a sixth. My break-even at 209.58 is fifty nine cents away rather than four and a half yen.
I record that not as vindication but as a warning to myself. The position has made money before the event it was constructed around has happened, which means the risk profile has changed. The convexity I paid for has largely been delivered by spot, and what remains is a coin flip on an announcement with a large gamma position attached. There is a reasonable argument for taking some of it off and leaving the December structure to carry the thesis.
What I still need on the day, in descending order of payoff, is a fifty basis point surprise, which is priced at nothing. Or Ueda declining to exclude October, which is the twenty eight per cent I keep returning to. Or a Federal Reserve hold on the 16th, which is my central expectation and only a third priced. Or a Bank of England disappointment at noon on the 17th. With Japan at 98 per cent priced, a plain twenty five with a gradualist tone remains a sell-the-fact, and from 210.17 that is now a squeeze back toward 213 rather than a slow bleed.
What Would Tell Me I Am Wrong
The largest near-term risk is the bottom right corner of the table in section 8. Both central banks hike twenty five, Ueda emphasises gradualism, October is explicitly parked, the yen is sold on the fact and the cross squeezes higher. That risk is there because September is so discounted though not raising 25bps isn’t the issue it’s the follow-through on intimations that the pace of hiking may step up.
The second is that the British part of this is simply early. If gilt yields keep rising and sterling strengthens with them, the market is still rewarding sterling’s carry and the good yield relationship holds. The 3 September repricing pattern is one afternoon of evidence, not a trend. By the way Sterling hasn’t been rising with yields higher of late.
The third is a benign global environment. If equities keep rising, volatility keeps falling and funding remains abundant, the leveraged carry ecosystem also has no reason to liquidate anything which is another trigger. The convexity in this position depends on conditions that do not currently exist which is why it’s good risk reward clearly.
The fourth is price. A sustained recovery back toward 216 to 220 in the face of continued hawkish repricing in Japan would be significant contrary evidence and I would treat it as such rather than explaining it away. On the profile, I would want to see the market rebuild a proper distribution above 214 rather than simply spike through it. A fast traverse back to 216 tells me very little. Three weeks of value building there tells me I am wrong.
That test cuts in both directions, and it is the one I will actually be running day to day. At each of the voids, 204 to 208 now and 172 to 180 later, I am watching time rather than price. A sharp reaction on arrival means the area held and the move needs re-examining. Time accumulating inside it means the area has been accepted and the next zone is coming. What I do not want to do is form a view from the first touch, because the first touch is the least informative moment in the sequence.
If the thesis is working, I would expect a cluster rather than a single move. Sterling falling against the yen and the franc simultaneously. The yen outperforming across G10. Japanese front end yields rising while the JGB curve begins to flatten, which it conspicuously has not done so far. Gilt yields rising while sterling falls. Equities weaker, realised volatility higher, credit spreads wider. Speculative yen shorts being covered, carry indices falling, and risk reversals moving in favour of yen calls.
Until several of those appear together, this remains a macro repricing position with a target of 195 and a reasonable prospect of getting there. It is only if they arrive together that the lower numbers become anything other than a tail.
Sources and Data
| No. | Reference |
|---|---|
| 1 | Bank of England, Monetary Policy Report — July 2026, 30 July 2026. The Bank expects GDP growth to remain subdued through 2026 and early 2027, with restrictive monetary policy weighing on demand and spare capacity widening. (bankofengland.co.uk) |
| 2 | Reuters, Bank of England’s Bailey sees ‘subdued’ second-round inflation effects for now, 28 August 2026. Bailey highlighted the soft labour market and said second-round inflation effects remained subdued. (reuters.com) |
| 3 | Bank of England, Bank Rate expectations in the UK curve following the war in Iran, 17 July 2026. Bank staff estimate that the upward slope of the short-end OIS curve largely reflects risk premia; stripping these out produces a broadly flat expected Bank Rate path over the following year, declining thereafter. (bankofengland.co.uk) |
| 4 | Bank of England, June 2026 Monetary Policy Summary and Minutes. The MPC noted that market participants’ most likely Bank Rate path was broadly flat and that models suggested the upward slope of the OIS curve was largely driven by risk premia. (bankofengland.co.uk) |
Data Sources
Totan ICAP TONA meeting-dated OIS composite and Tullett Prebon central bank meeting dates OIS composite, both 3 September 2026. Bank of Japan Financial Markets Department, uncollateralized overnight call rate final results for 2 September 2026. US Bureau of Labor Statistics preliminary benchmark revision, 28 August 2026.
This note describes a position held by the author. It is not investment advice and it is not a recommendation.